This family of metrics rely on the maximum distance within a point cloud
Usage
maxdist(x, s, ...)

mgcd(x, ...)

# S4 method for class 'matrix,missing'
maxdist(
  x,
  dm = NULL,
  long = NULL,
  lat = NULL,
  duplicates = FALSE,
  plot = FALSE,
  plot.args = NULL,
  full = FALSE,
  q = 1
)

# S4 method for class 'data.frame,missing'
maxdist(
  x,
  long = "long",
  lat = "lat",
  tax = NULL,
  dm = NULL,
  duplicates = FALSE,
  q = 1,
  plot = FALSE,
  plot.args = NULL,
  full = FALSE
)
Arguments
- x
Either a 2D numeric
matrixwith two columns: longitudes and latitudes, adata.framewith the same information.- s
Substitute spatial structure. An icosahedral grid object the inherits from the
trigridclass. Providing this argumnet reduces the point cloud to the centers of the grid cells. (not yet)- ...
Additional arguments passed to class-specific methods.
- dm
If there is a pre-made distance matrix, it can be plugged in here. If this is provided, the default coordinates will not be used.
- long
character, column name of the longitudes.- lat
character, column name of the latitudes.- duplicates
logical, should identical coordinates be included in the calculation (default isFALSE)- plot
Logical, should the result be plotted? Will plot over active plot (as in
add=TRUE).- plot.args
List arguments passed to the plotting function:
sf::plot.- full
logical, should only the estimate (FALSE) be returned, or additional data as well?(TRUE).- q
numeric, a value between 0 and 1, the quantile.- tax
character, used only in thedata.framemethod. Column name of groups (e.g. taxa) that allows the iteration of the method for multiple groups.
Value
A list with an estimate an two indices the rows of the input matrix that represent the longest great circle (or one of them).
Examples
# 1. Records
data(pinna)
# Subset to Pinna nobilis
nobilis <- pinna[pinna$species=="Pinna nobilis", ]
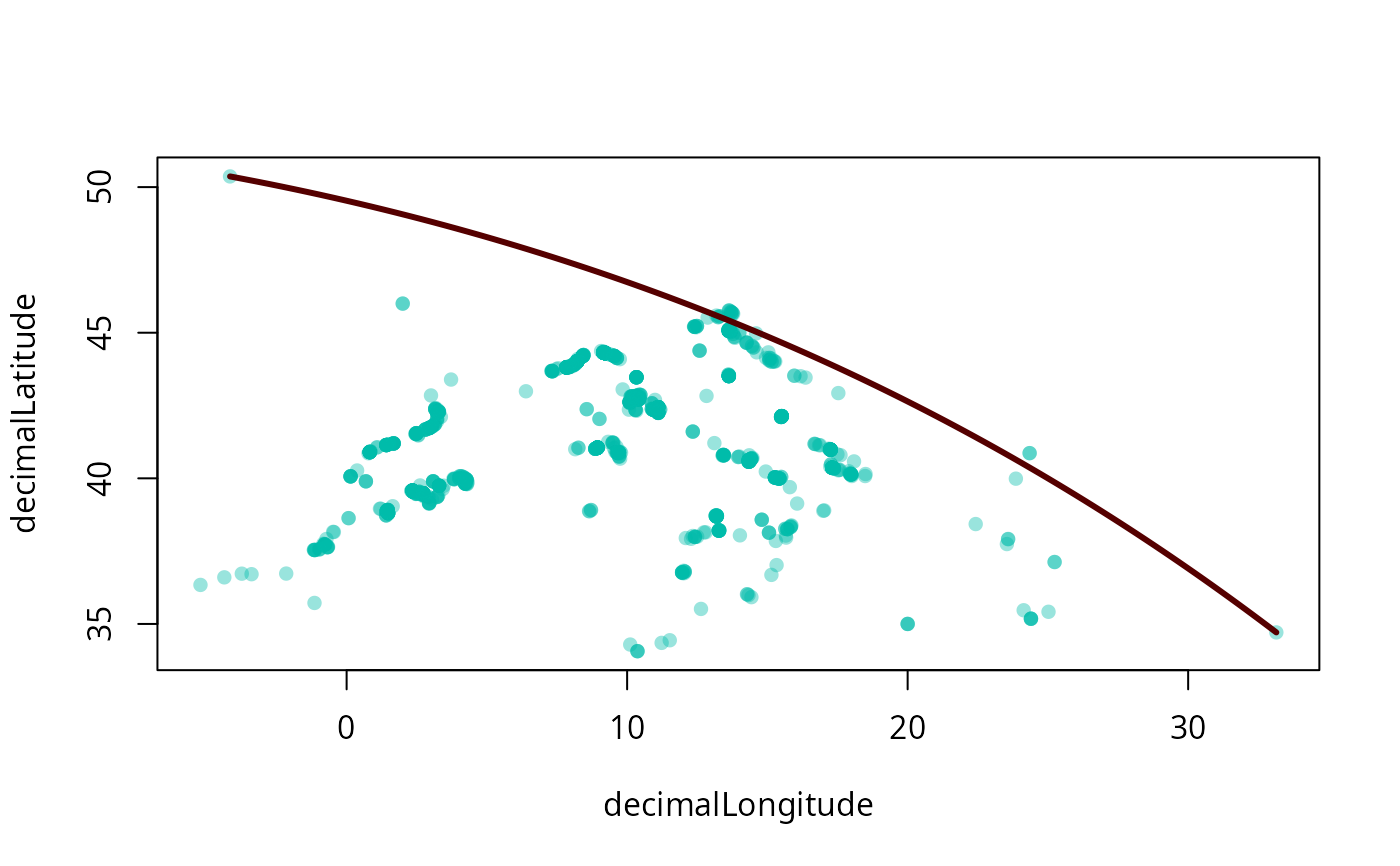
plot(nobilis[c("decimalLongitude", "decimalLatitude")], pch=16, col="#00BBAA66")

# 2. calculate and visualize
mgcd <- maxdist(nobilis, long="decimalLongitude", lat="decimalLatitude", plot=TRUE, full=TRUE)