High-level, abstract function to calculate how many or what proporotion of components in a pre-specified spatial structure is occupied by a distribution dataset
Usage
occupancy(x, s, ...)

# S4 method for class 'matrix,missing'
occupancy(x, long = NULL, lat = NULL, full = FALSE, prop = NULL)

# S4 method for class 'data.frame,missing'
occupancy(
  x,
  tax = NULL,
  long = "long",
  lat = "lat",
  full = FALSE,
  listarray = TRUE,
  prop = NULL
)

# S4 method for class 'data.frame,character'
occupancy(x, s, tax = NULL, full = FALSE, prop = NULL, listarray = TRUE)

# S4 method for class 'matrix,trigrid'
occupancy(
  x,
  s,
  long = NULL,
  lat = NULL,
  q = 1,
  plot = FALSE,
  plot.args = NULL,
  full = FALSE,
  prop = NULL
)

# S4 method for class 'data.frame,trigrid'
occupancy(
  x,
  s,
  long = "long",
  lat = "lat",
  tax = NULL,
  q = 1,
  plot = FALSE,
  plot.args = NULL,
  full = FALSE,
  prop = NULL
)
Arguments
- x
Eiher a 2-column numeric matrix with two columns: longitudes and latitudes, or a
data.framewith these columns.- s
Structure to be occupied, either
NULL(coordinate pairs),character(column name indicating locality) or atrigrid(icosahedral grid from the package icosa).- ...
Additional arguments passed to class-specific methods.
- long
character, column name of the longitudes.- lat
character, column name of the latitudes.- full
Logical switch indicating whether only the estimate should be shown (
FALSE), or other info (i.e. the list of occupied components ins) as well.- prop
Should counts be returned (
prop=NULL), or proportions? Ifprop="global", then global proportions are returned, ifprop="relative", relative proporitions are calculated.- tax
character, used only in thedata.framemethod. Column name of groups (e.g. taxa) that allows the iteration of the method for multiple groups.- listarray
If the full traceable output is required, should this be organized with list-array (native output of tapply).
- q
Minimum occupancy with
qproportion of occurrences (not yet implemented!).- plot
Logical, should the result be plotted? Will plot over active plot (as in
add=TRUE).- plot.args
List arguments passed to the plotting function:
lines.
Value
For single subsets (tax=NULL) either a single numeric or an orange list with an estimate and other information. Iterations for multiple taxa result in a named numeric vector or a list.
Details
The function by default returns counts (i.e. natural numbers) of how many discrete units are occupied.
However, there are many cases, when proportions are much more useful, which can be set with the prop argument.
Proportions are either global (prop="global") or relative (prop="relative"). Global proportions express how much of the overall spatial structure (s) is occupied; for example, what is the proportion of cells in a grid that are occupied.
This method is only applicable, when s is defined as a spatial structure that is independent from x.
In contrast, relative proportional occupancies express proportions in the sampled set, i.e. what proportion of the overall sampled grid cells or localities are occupied by a taxon. This is particularly useful when tax!=NULL.
Examples
# I. Single taxon: Pinna nobils
# 1. Records
data(pinna)
# Subset to Pinna nobilis
nobilis <- pinna[pinna$species=="Pinna nobilis", ]

# Number of unique coordinate pairs
cpairs <- occupancy(nobilis, long="decimalLongitude", lat="decimalLatitude")

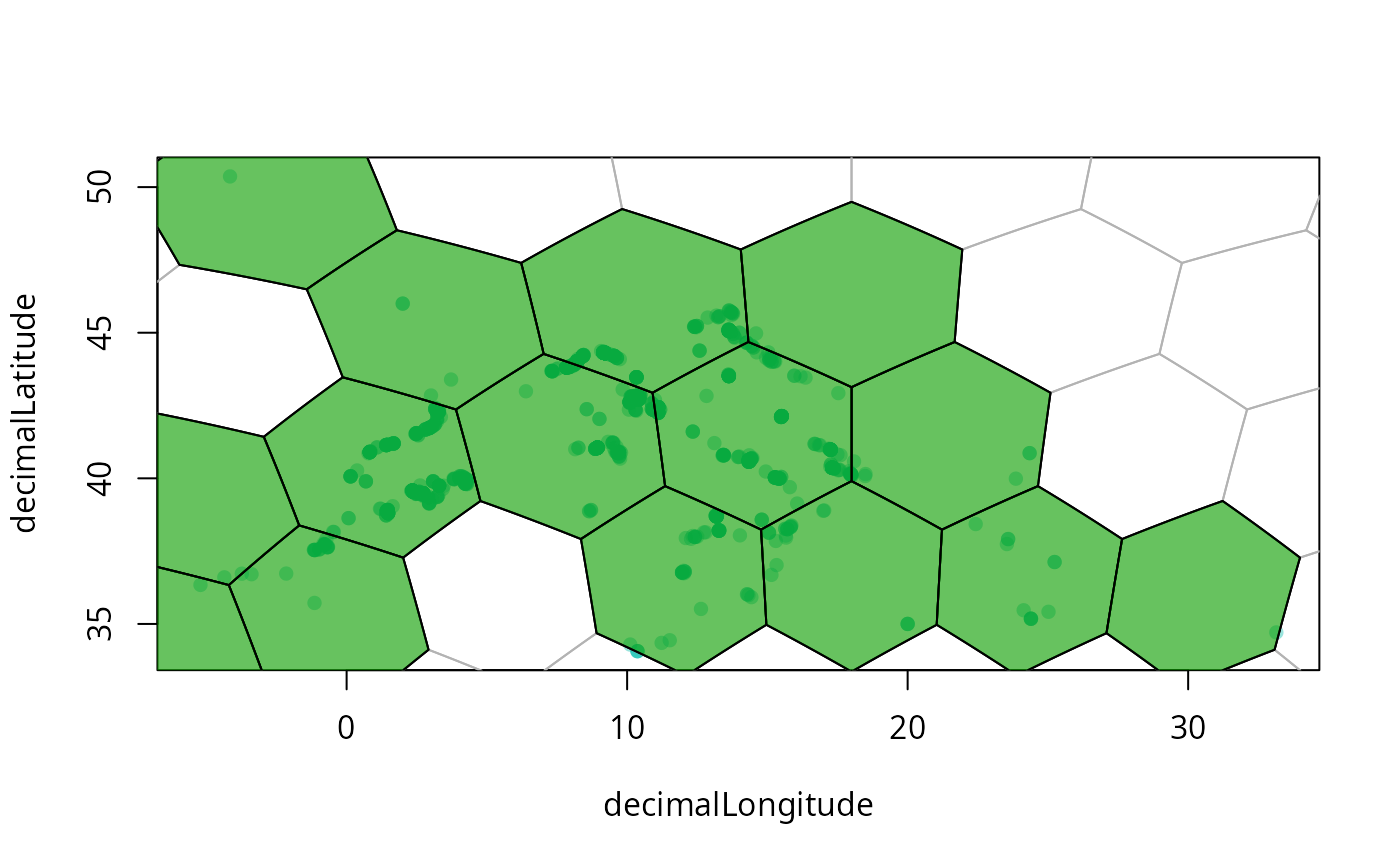
# 2. Occupancy in icosahedral grid
hex <- hexagrid(deg=5, sf=TRUE)
#> Selecting hexagrid with tessellation vector: c(2, 4).
#> Mean edge length: 4.993 degrees.
plot(nobilis[c("decimalLongitude", "decimalLatitude")], pch=16, col="#00BBAA66",
  xlim=c(-20,45), ylim=c(20,60))
plot(hex, border="gray70", add=TRUE)

# calculate occupancy
occ <- occupancy(nobilis, s=hex, plot=TRUE,
  long="decimalLongitude", lat="decimalLatitude", full=TRUE)

# manual coloring from full output
plot(hex, occ$occupied, add=TRUE, col="#00BB0088")