Create a calibrated color ramp object from color-tiepoint data.frames
Source:R/calibramp.R
expand.RdCreate ramp palettes from fixed color positions.
Arguments
- x
A
data.frameobject with two columns:colorfor hexadecimal color values,zfor their position.- n
A single
integernumber.- color
A
chraractervalue, the column name of the colors inx, defaults to"color". Alternatively, acharactervector of hexadecimal color values, with the same length asz.- z
A
charactervalue, the column name of the values inx, defaults to"z". Alternatively, anumericvector of color values (must have the same length ascolor.- ...
Arguments passed to the
colorRampPalettefunction.
Details
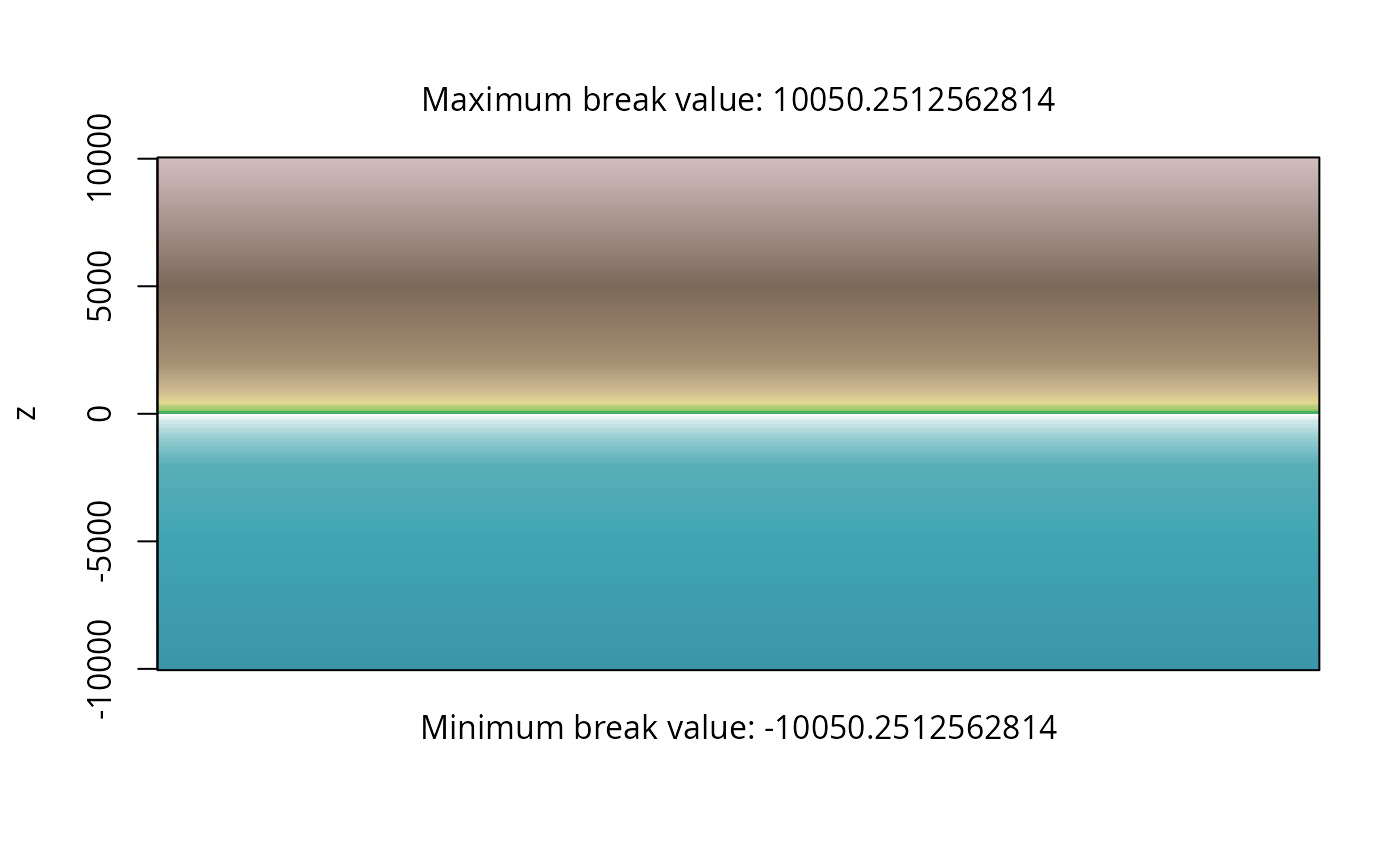
The function creates objects of the S3 class calibramp. The calibramp-class lists have three elements: col hexadecimal color values, mid: z-values of midpoints (one for every color), and breaks: separator borders between color values.
Color interpolation will be executed linearly, using colorRampPalette, the order of the values will be forced to ascending, the values in mid will be halfway between breaks.