Contains functions produced by the colorRampPalette function.
Details
You can also view single palettes individually. The following color palettes are implemented:
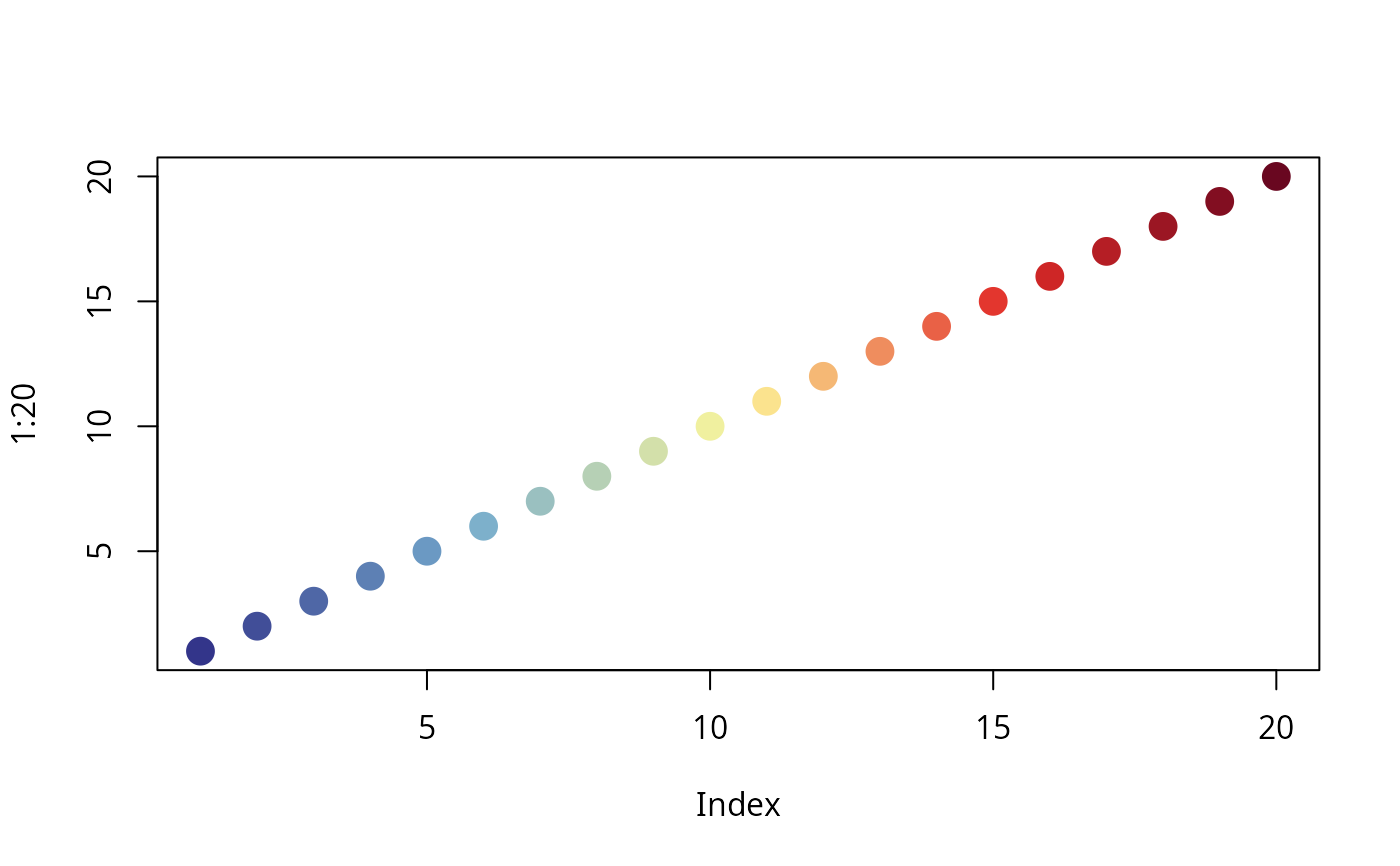
gradinv(): inverse heatmap, primarily intended to emphasize distinctions between no-change (yellow) and change (blue/red) cases. Based on the color blindness simulator Coblis, the palette is very color disability-friendly, except for monochromacy/achromatopsia, where the two change scenarios (red and blue) become very difficult to distinguish. Additional markings (e.g. labels indicating high and low) are recommended for these cases.
Examples
cols <- gradinv(20)
plot(1:20, col=cols, pch=16, cex=2)