The function is a wrapper around the points function, controlling the color of the points similar to ggplot, but using S-style plotting.
If neither ramp, nor col or breaks are given, the function will default to using the internal gradinv palette with 256 levels evenly distributed from the minimum to the maximum of z.
Usage
colorpoints(
  x,
  y = NULL,
  z,
  ramp = NULL,
  col = NULL,
  breaks = NULL,
  legend = list(x = "topleft"),
  ...
)
Arguments
- x
The
xargument ofpoints.- y
The
yargument ofpoints.- z
numeric, the variable to visualize using the colors.- ramp
A
calibramp-class object (including bothbreaksandcolors).- col
A vector of colors. Used only if
rampis not given.- breaks
A vector of breaks. If given, this has to be one element longer than the length of
col.- legend
A list of arguments passed to the
ramplegendfunction. Set toNULLif you do not want to plot a legend.- ...
Arguments passed to the
pointsfunction.
Examples
# random points
set.seed(1)
x <- rnorm(5000) # x coord
y <- rnorm(5000) # y coord
dist <- sqrt(x^2+y^2) # distance from origin
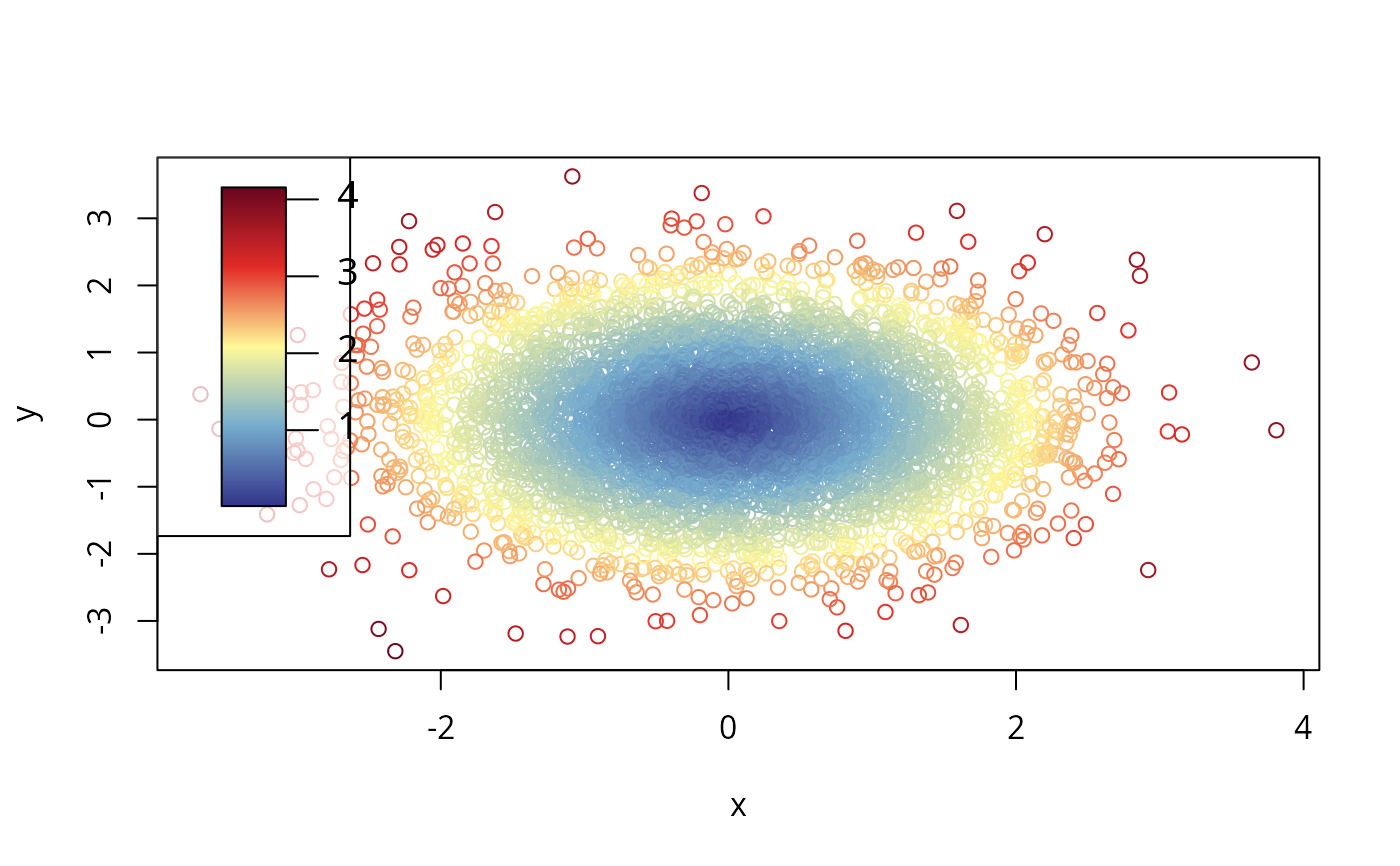
# default plotting
plot(x,y, col=NA)
colorpoints(x=x, y=y, z=dist)
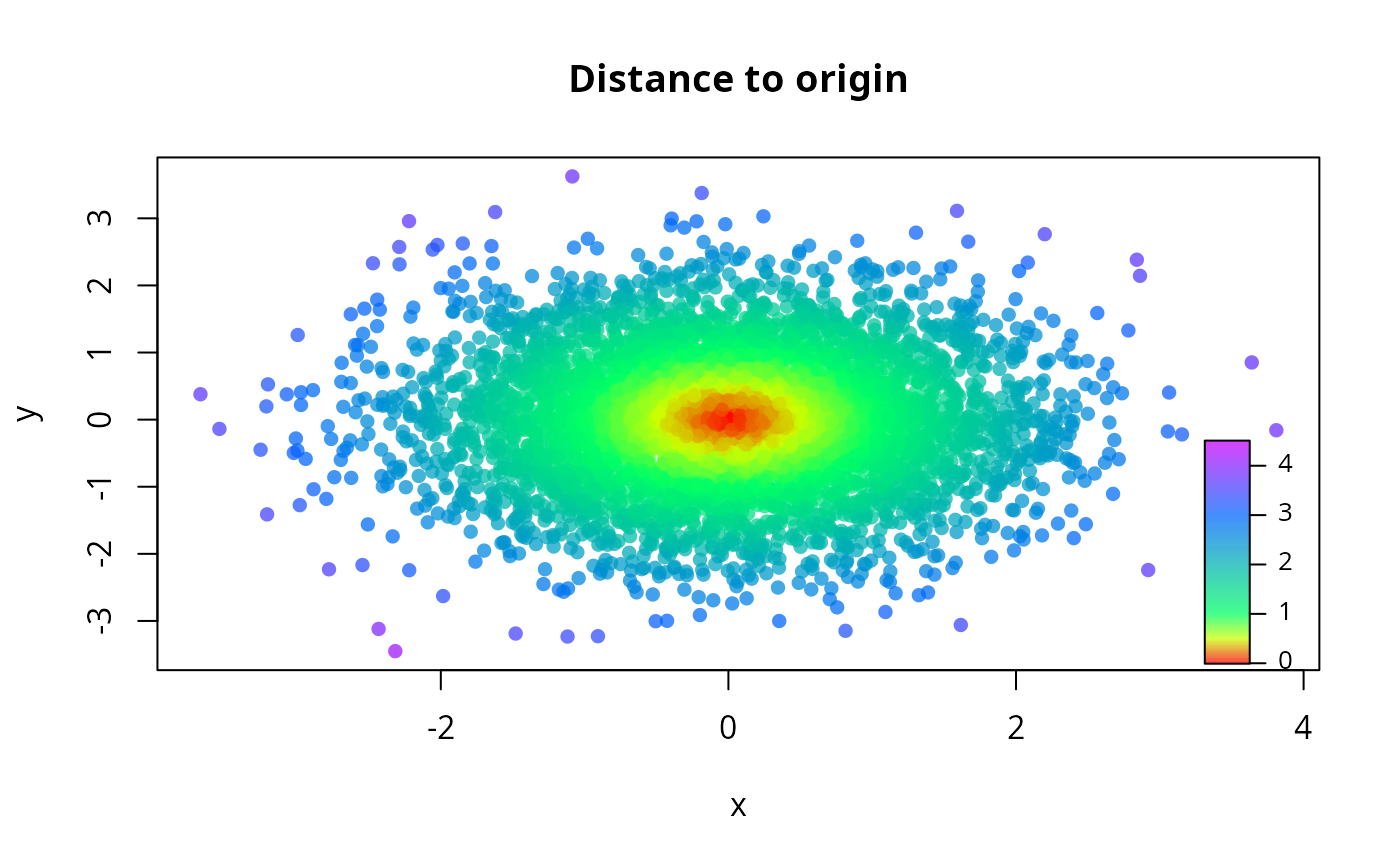
 # custom color scheme
levs<- data.frame(color=rainbow(5), z=c(0, 0.5,1, 3, 4.5))
ramp <-expand(levs, n=256)
# very customized (experiment with difference device sizes!)
plot(x,y, col=NA, main="Distance to origin")
colorpoints(x=x, y=y, z=dist,
col=paste0(ramp$col, "BB"),
breaks=ramp$breaks,
pch=16,
legend=list(x=3,y=0,cex=0.7, box.args=list(border=NA)))
# custom color scheme
levs<- data.frame(color=rainbow(5), z=c(0, 0.5,1, 3, 4.5))
ramp <-expand(levs, n=256)
# very customized (experiment with difference device sizes!)
plot(x,y, col=NA, main="Distance to origin")
colorpoints(x=x, y=y, z=dist,
col=paste0(ramp$col, "BB"),
breaks=ramp$breaks,
pch=16,
legend=list(x=3,y=0,cex=0.7, box.args=list(border=NA)))