Optional legend for cases where calibramp objects are used.
Arguments
- x
Position of the legend or the left coordinate of legend box. Either a numeric coordinate value or a the
"topleft","topright","bottomleft"or"bottomright".- y
Coordinate of the upper edge of the legend (if needed).
- shift
Used instead of the inset argument of the default legend. If plotted within the inner plotting area, the x and y user coordinates with which the position of the legend will be shifted.
- ramp
A calibrated color ramp object. Either
rampor bothcolandbreaksare required.- col
Vector of colors.
- breaks
Breaks between the colors.
- zlim
A numeric vector with two values, passed to
trimramp. The low and high extreme values to be shown on the legend.- height
Height of the legend bar in inches.
- width
Width of the legend bar in inches.
- tick.length
The length of the legend's ticks.
- cex
Legend size scaler.
- box.args
the box's arguments.
- horizontal
Legend orientation. Not yet implemented
- at
Where should the legend be drawn in the z dimension?
- label
What are the labels
Examples
# example with colored points
# basic points
v <- seq(0,20, 0.01)
sine <- sin(v)
# visualize as a plot
plot(v,sine)
# colors for sine values
levs<- data.frame(color=gradinv(5), z=c(-1, -0.2, 0, 0.2, 1))
ramp<- expand(levs, n=256)
# colored points
colorpoints(x=v, y=sine, z=sine, cex=6, pch=16, legend=NULL)
# the legend
ramplegend(x=0, y=0.3, ramp=ramp, cex=0.5, box.args=list(border=NA, col=NA))
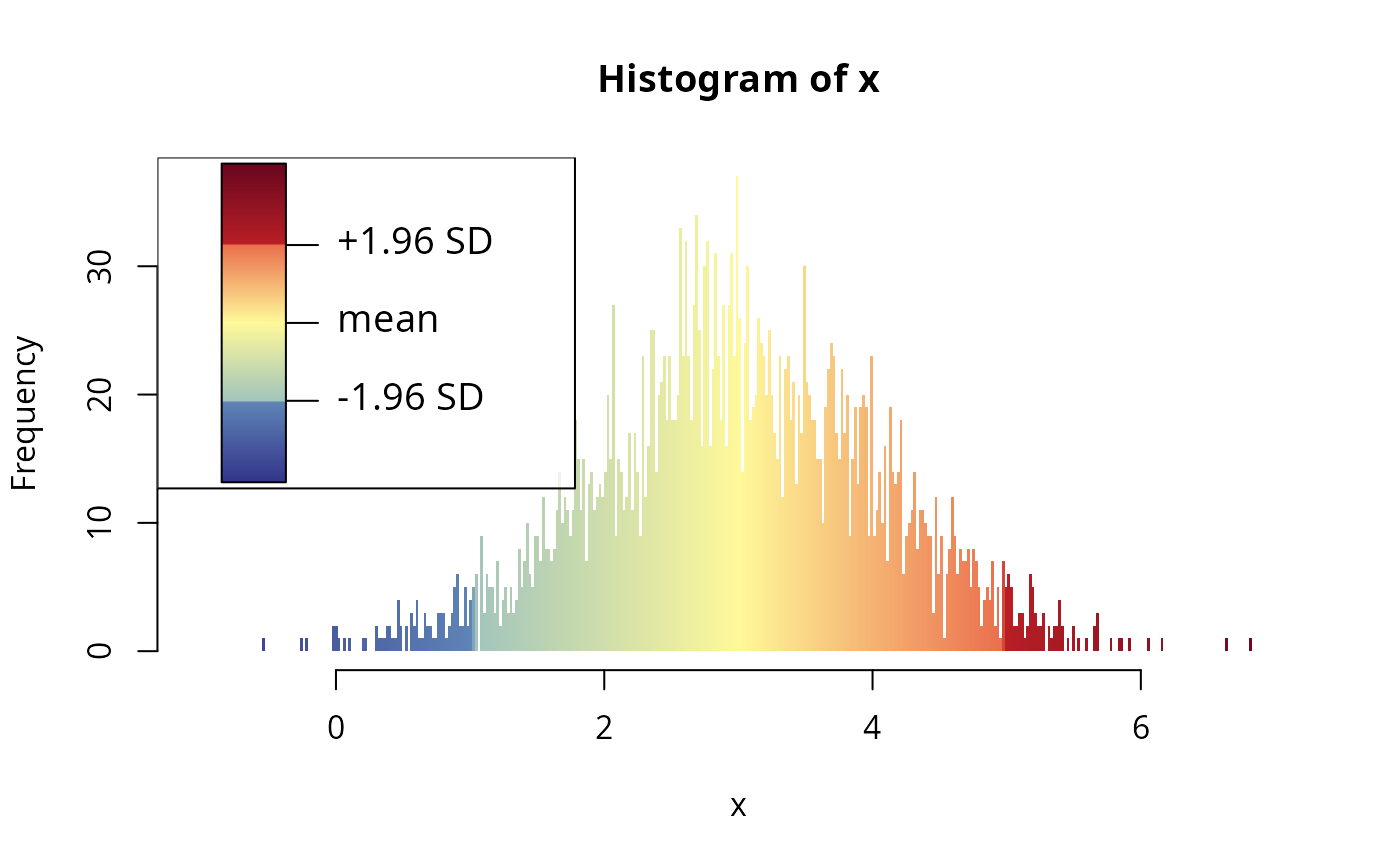
 # example with histogram
set.seed(1)
x <- rnorm(3000, 3,1)
levs<- data.frame(color=gradinv(7), z=c(-1, 1,1.04, 3, 4.96, 5, 7))
ramp <-expand(levs, n=400)
# histogram showing distribution
hist(x, col=ramp$col, breaks=ramp$breaks, border=NA)
ramplegend("topleft", ramp=ramp, at=c(1.04, 3, 4.96), label=c("-1.96 SD", "mean", "+1.96 SD"))
# example with histogram
set.seed(1)
x <- rnorm(3000, 3,1)
levs<- data.frame(color=gradinv(7), z=c(-1, 1,1.04, 3, 4.96, 5, 7))
ramp <-expand(levs, n=400)
# histogram showing distribution
hist(x, col=ramp$col, breaks=ramp$breaks, border=NA)
ramplegend("topleft", ramp=ramp, at=c(1.04, 3, 4.96), label=c("-1.96 SD", "mean", "+1.96 SD"))
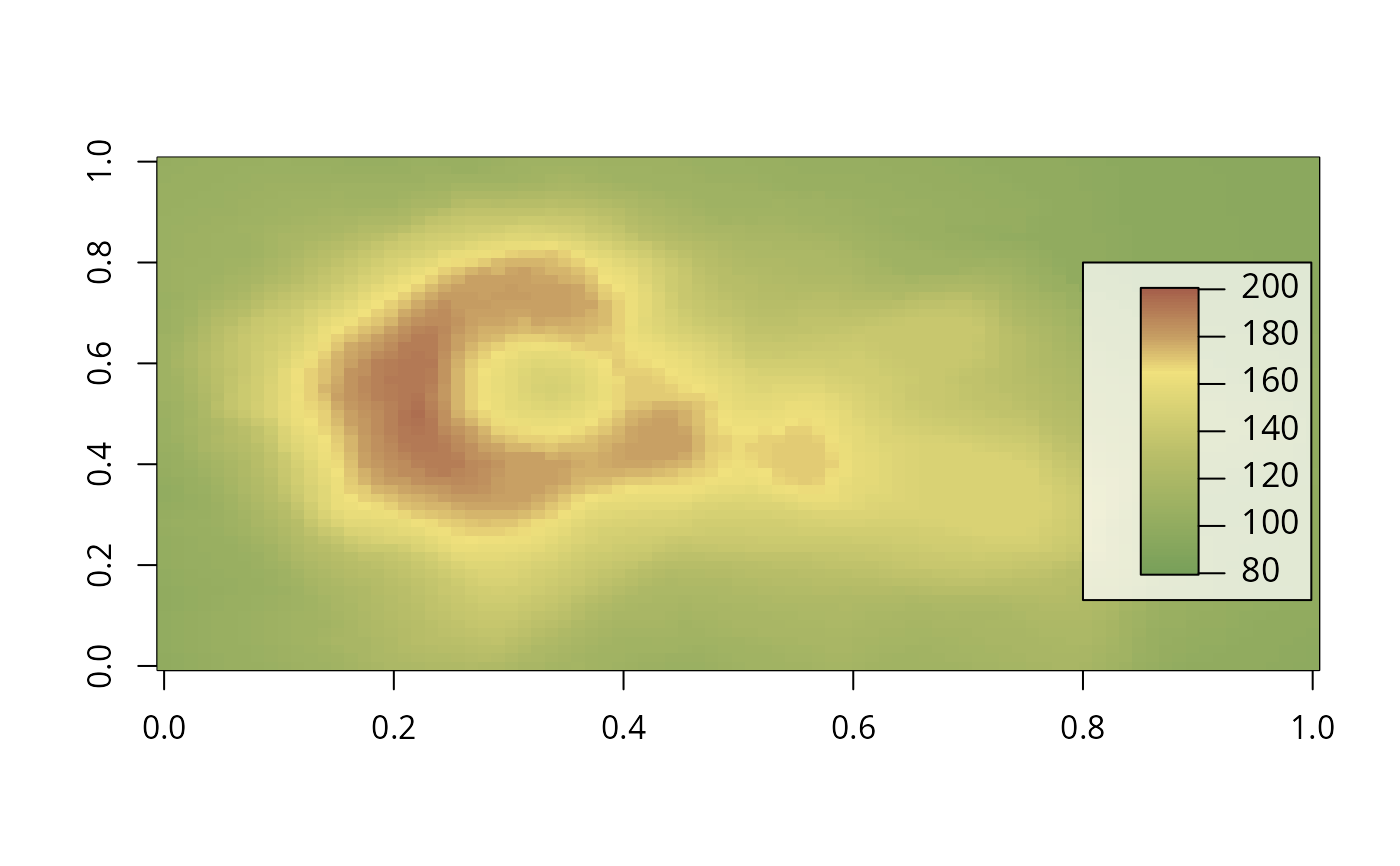
 # example with volcano
data(volcano)
data(topos)
# create ramp
levs <- topos$jakarta[topos$jakarta$z>0,]
levs$z <- c(200, 180, 165, 130, 80)
ramp <-expand(levs, n=100)
image(volcano, col=ramp$col, breaks=ramp$breaks)
ramplegend(x=0.8, y=0.8, ramp=ramp, cex=0.9)
# example with volcano
data(volcano)
data(topos)
# create ramp
levs <- topos$jakarta[topos$jakarta$z>0,]
levs$z <- c(200, 180, 165, 130, 80)
ramp <-expand(levs, n=100)
image(volcano, col=ramp$col, breaks=ramp$breaks)
ramplegend(x=0.8, y=0.8, ramp=ramp, cex=0.9)