Skip to contents

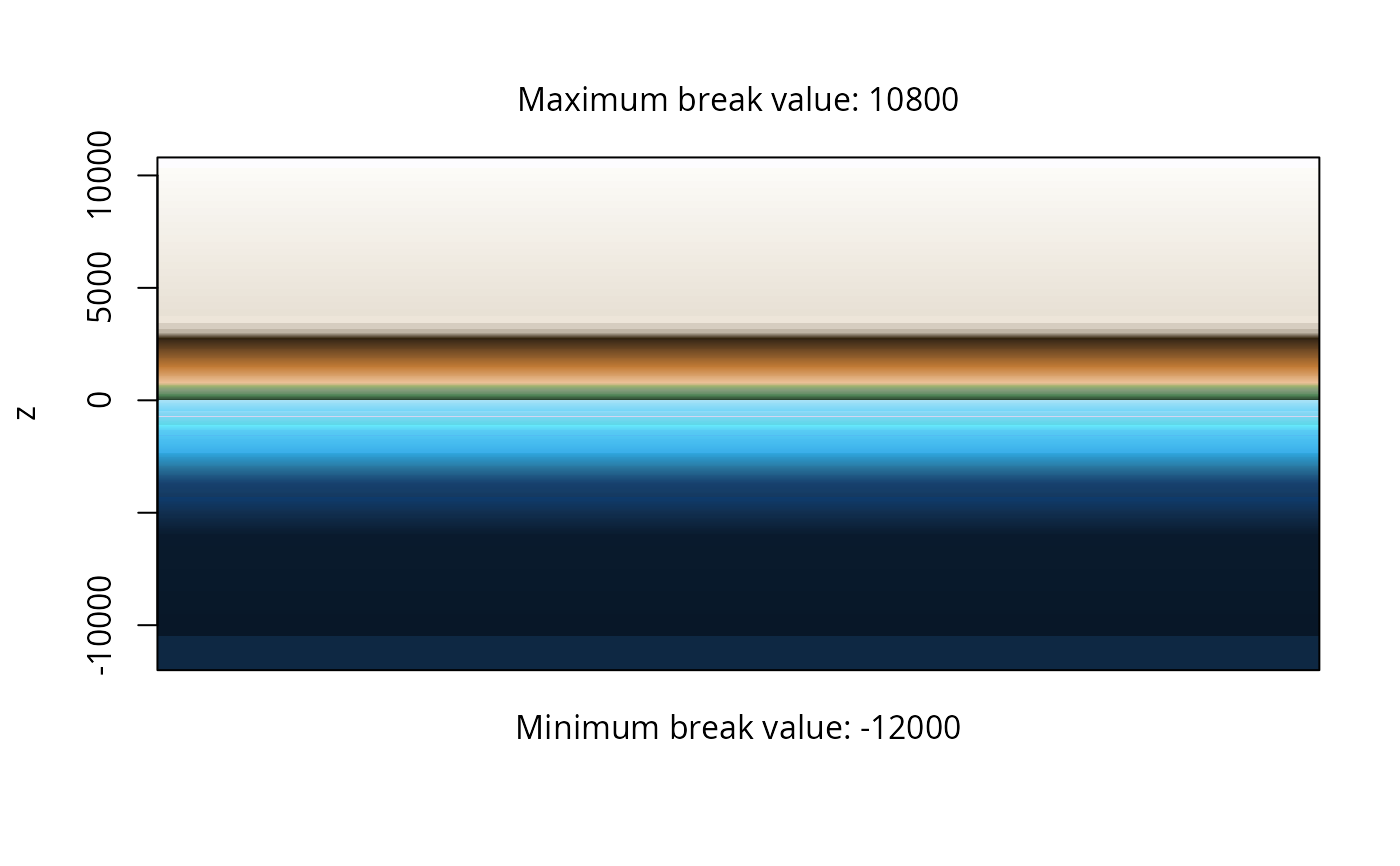
The method can be used to inspect and visualize calbirated color ramp object.

Usage

# S3 method for class 'calibramp'
plot(x, ...)

rampplot(
  x,
  breaks = FALSE,
  breaklabs = TRUE,
  axis.args = list(side = 2),
  ylab = "z",
  xlab = ""
)

Arguments

x

The calibirated color ramp object (calibramp-class object).

...

Arguments passed to the rampplot function.

breaks

Should the distribution of breaks be visualized?

breaklabs

Should the minimum and maximum break labels be visualized?

axis.args

Arguments passed to the axis function.

ylab

y-axis label.

xlab

x-axis label.

Value

The functions have no return values.

Examples

# the paleomap ramp
data(paleomap)
plot(paleomap)

# 0-calibrated, expanded ramp
tiepoints <- data.frame(z=c(c(-1, -0.1, 0, 0.1, +1)), color=gradinv(5))
ramp <- expand(tiepoints, n=255)
plot(ramp)